Year 2022 in Review
We have traveled much less in 2022 than in 2021. This is mostly due to our current sedentarization project (as well as overall increased workload). We have spent much more time at my mother's place, to study the state of real estate in Alsace.
I've shared some pictures of the trip on our instagram page. In this blog post, I provide a review of our year 2022 in numbers.
The trips
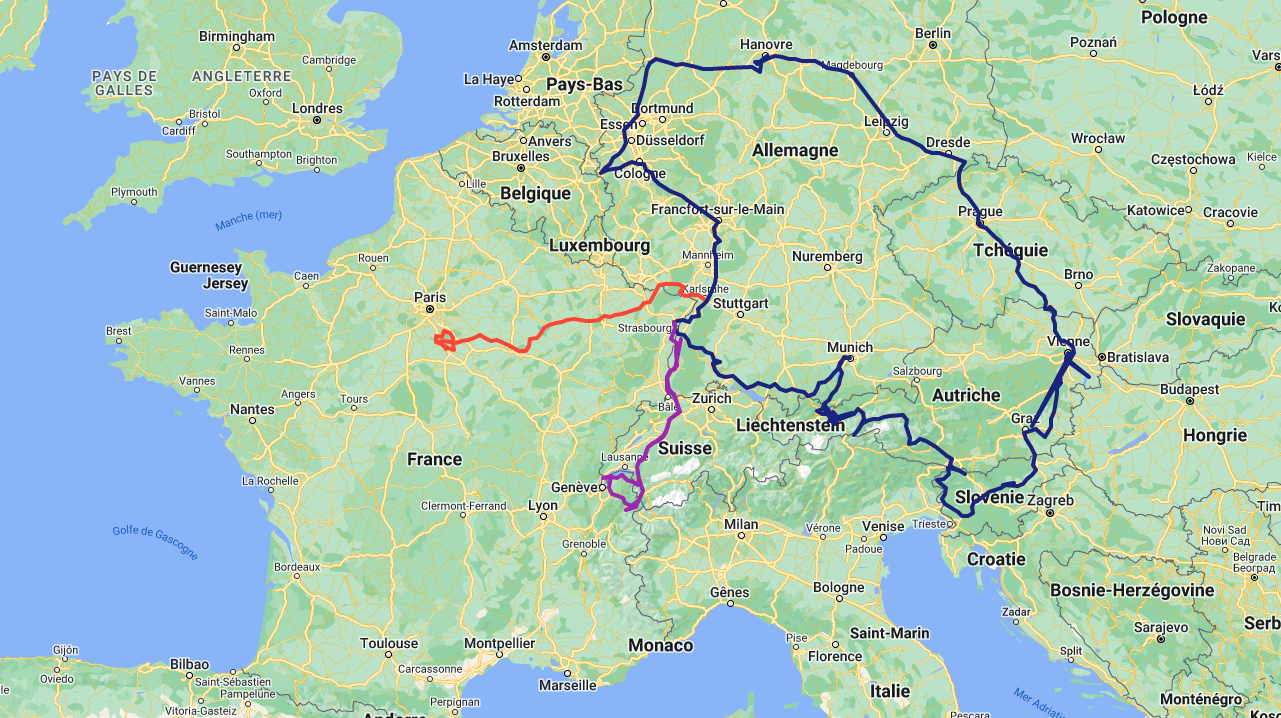
Our first trip of the year was related to our sedentarization project. We left three weeks in mid-April, first driving to Nanteau-sur-Lunain near Paris. There, we helped out Jean to self-build his own house using the EcoCocon straw panel system, which we were also considering for us. We returned home over Wissembourg, and spent some days at the Ecolieu Langenberg. This Ecolieu consists of a German/French collective, sharing an old castle in the woods near the border. We have helped them by plastering a straw wall with adobe and laying a parquet floor in a renovated apartment.
We then did a short trip in June, mostly visiting the places around the lake of Geneva and hiking near Chamonix Mont Blanc. Our longest trip of the year was from July 7th to August 24th. This time we traveled towards the East: we visited castles in Bavaria, mountains in Austria, more mountains in Slovenia, friends in the Czech Republic and more friends in Germany.
 Kaiserschmarrn on the Zugspitze
 Visiting Zotter chocolate factory
 Catching up with Elina
The data
Gas prices were quite volatile this year. Looking at the data, compared to last year, it was 8% more expensive to drive on E10 and 25% more expensive to drive on GNC, while driving on BioGNC was the same price. One reason why we traveled East was also because it was much simpler to find GNC and BioGNC. In 2022, we drove a total of 7717km, compared to 16806km in 2021, and mostly using GNC or BioGNC.
 Fuel cost
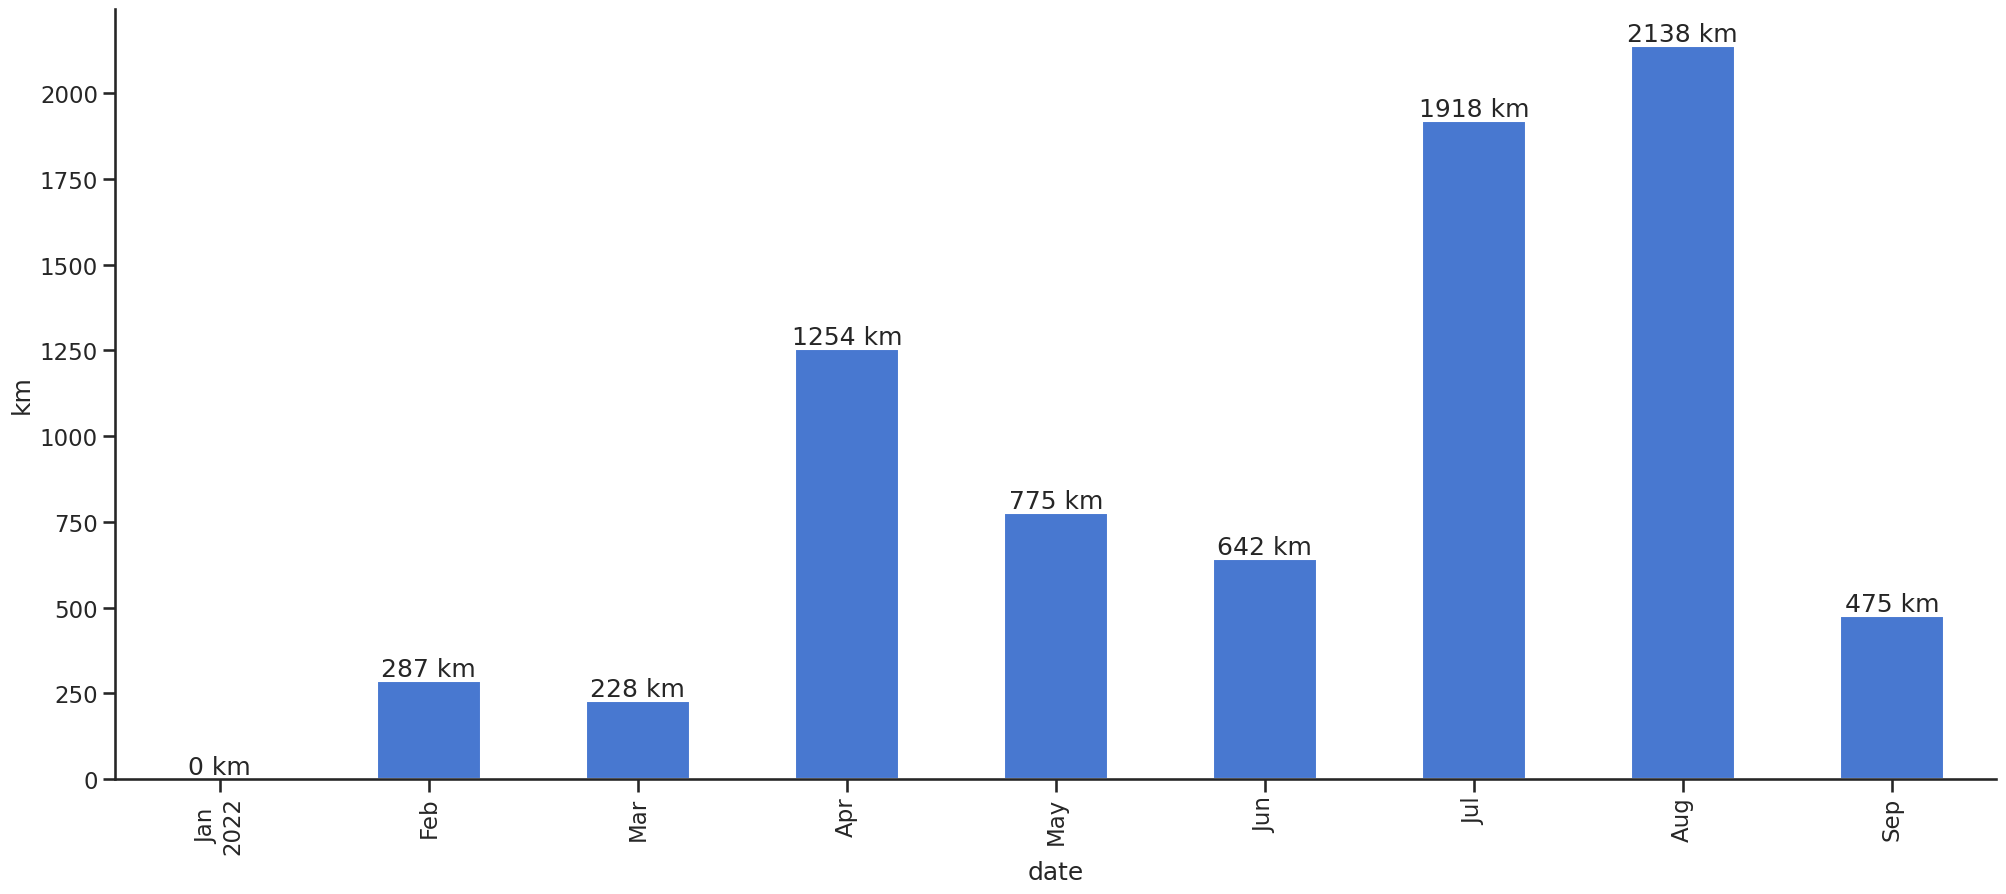 Driven kilometers per month
Less driving helped us decrease our fuel consumption, and thus our carbon footprint. I have calculated the carbon footprint of driving the van this year to 1562 kg CO2 equivalent (compared to 4656 kg in 2021: that's a 66% reduction). Note that we did not tank the van in November and December. We also sporadically borrowed my mother's car, which I did not account for. While at home, we mostly relied on public transportation.
 Fuel consumption
This year I also tracked my meat and fish consumption between July and December for 143 days. I've tracked it manually in a table, which wasn't really practical: I won't continue doing it next year. On average, I've eaten 680g of meat or fish product per week, which was dominated by the consumption of pork by 45%.
 Meat consumption quantity
I've looked up the footprint of the items I've tracked in the new agribalyse database from Ademe. This way, I've calculated the carbon footprint of my meat and fish consumption to be 181 kg CO2 equivalent, for 143 days. It was dominated by the consumption of beef, accounting 55% of this footprint, while only representing 21% of my consumption. Consumption of pork only accounted for 18% of this footprint.
 Meat carbon footprint
What's next
We have now bought a building terrain, at the feet of northern Vosges mountains near Saverne. In 2023, the objective is to build a certified passive house dwelling.