Exploring France, Spain and Portugal
It was about a year ago that we left with the van. We were on the road living in the van from May to mid-December 2021, in a succession of three round trips. Since December, we are back at my mother place, starting only now again with smaller trip. It was our intention to return to our families for Christmas, but also because winter is more comfortable in a house than in a van. We followed our plans around the coast of France, Spain and Portugal (even England with Gibraltar). We were in time for Camille's hypnosis training in August in Avignon, and she graduated. Also, we almost forgot about the pandemic, as we didn't have a TV and didn't meet much people either. In that respect, vanlife is rather lonely, in the sense that we could only establish short-term relationships.
I've shared the pretty landscape pictures on our instagram page. In this blog post, I provide an analysis of our vanlife, supported by data I collected during our trip. If you're interested in the method, I've open-sourced the code I used to process and plot data.
Driving
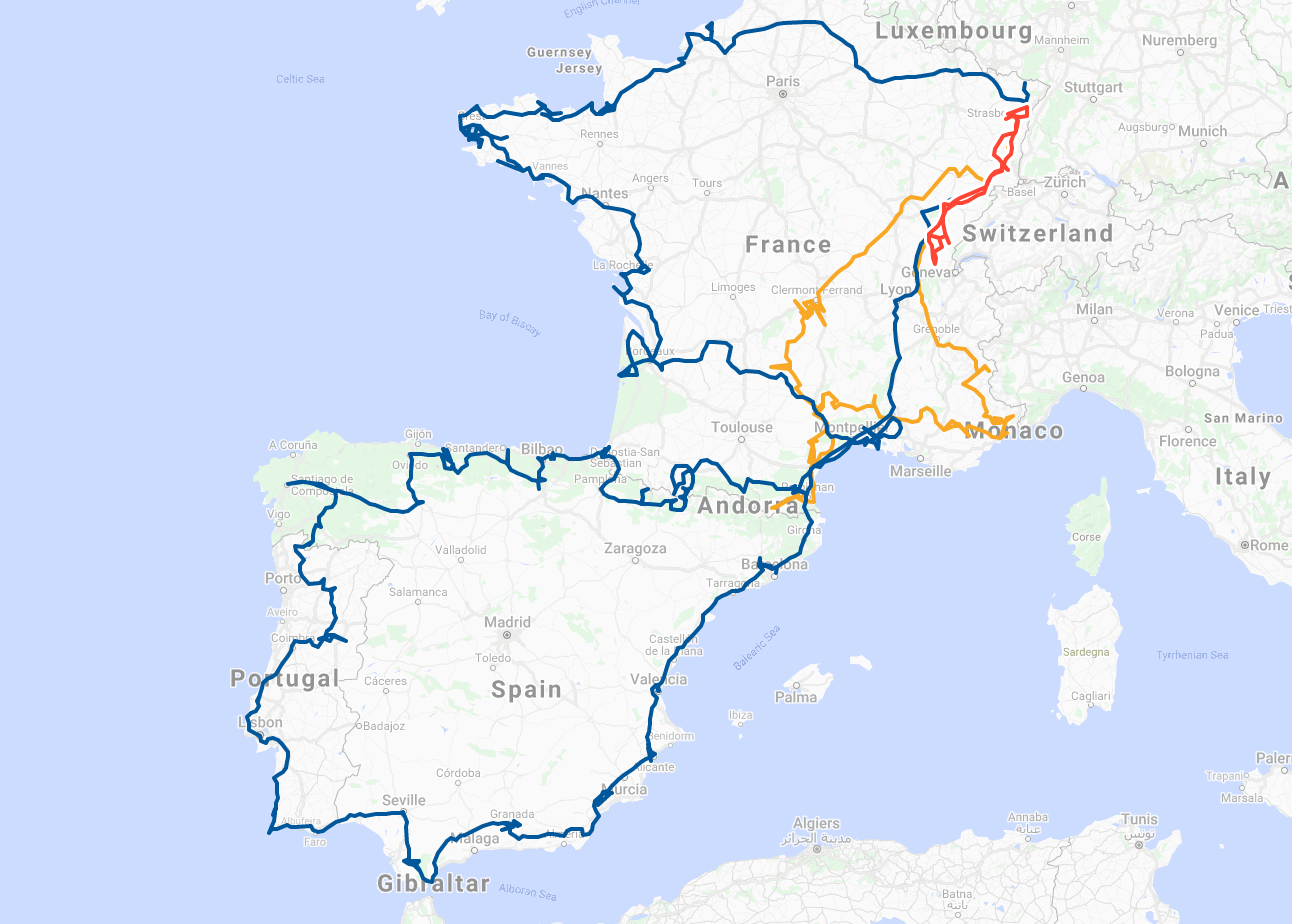
Let's start with a map of our three round trips, automatically generated from google location history data.
In 210 days of vanlife, we drove 16336km, averaging to a cruising speed of 78km/day. This number is quite high for us, who never owned a car before, as we always lived in well-connected cities. It also reflects that we were changing our sleeping spot and moving forward almost every day.
 Driven kilometers per month
The month we drove the most kilometers were July and August, mainly because we needed to reach Avignon in time for Camille's training. The month that we drove the least during the trip was September with 1462km, when we were in the Pyrenees: there was a lot to do there and we loved this place. Since December, we are back to transitional sedentary life at my mother and we drove another 2511km in 147 days (average 17km/day).
Vanlife is new to us and very different from our previous, sedentary lifestyle. How did this change impact our carbon footprint? This was an important question for me, which is why I recorded all the fuel we tanked.
Carbon footprint
Disclaimer: the simulators available online to estimate carbon footprint are not adapted to vanlife. Because we transitioned lifestyle during the course of the year, the calculation of our yearly footprint is too involved. Instead I'm here sketching the most important components of our carbon footprint from scratch, using the data collected during the trip. I'll draw some comparisons between our footprint and an average French footprint, taken from this carbone4 study. Like the average French, our carbon footprint is dominated by transportation.
 Fuel consumption
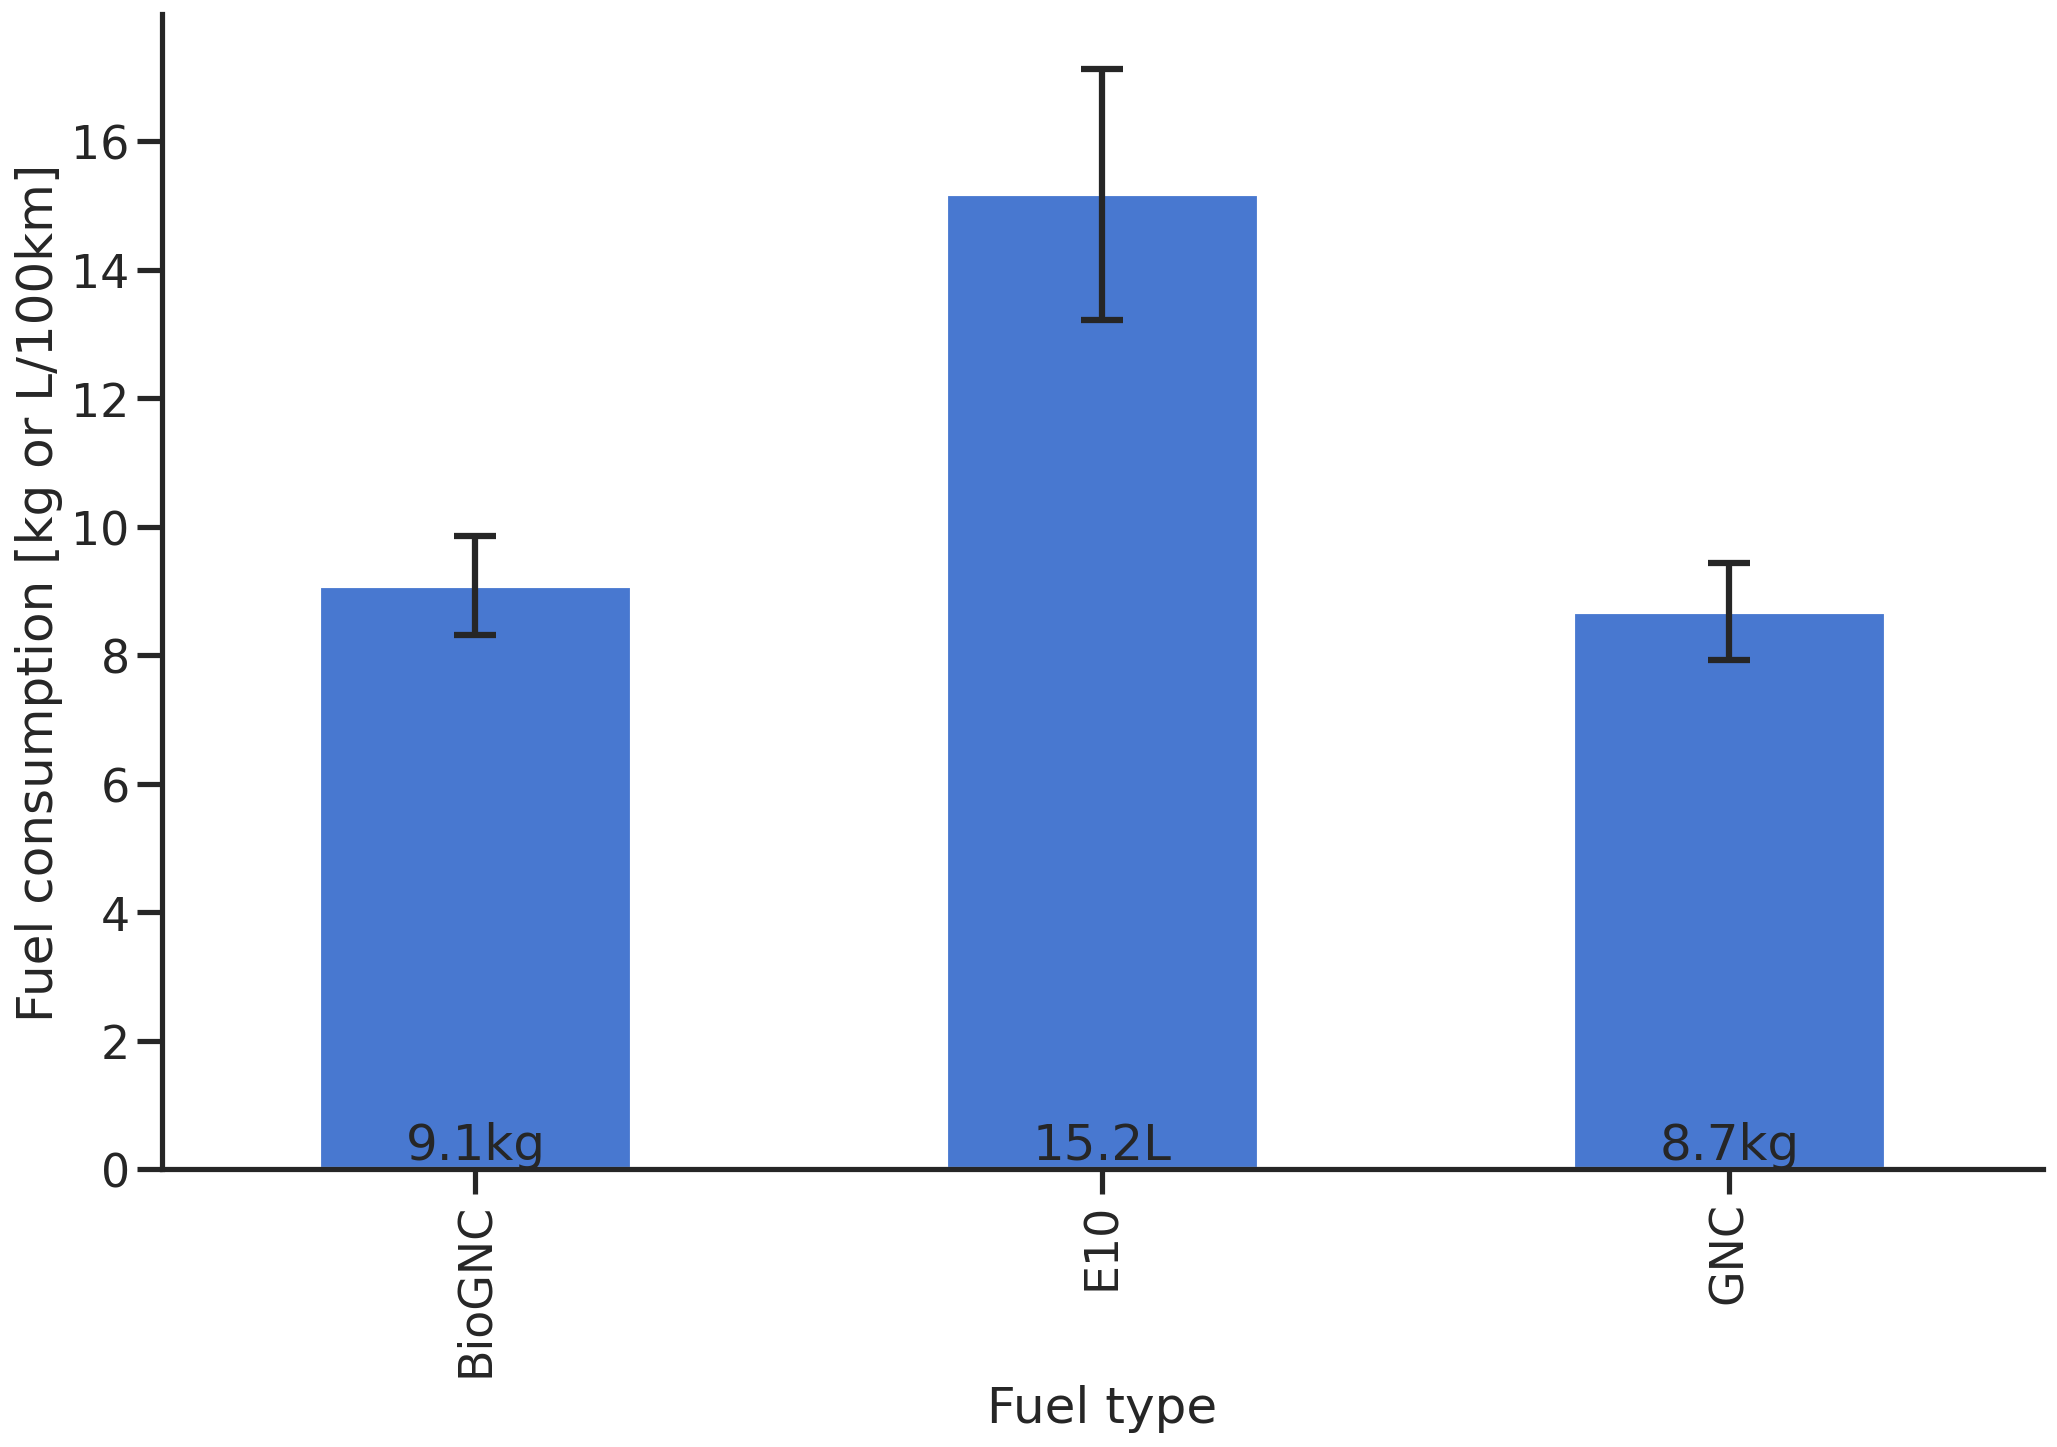
Most vans drive with diesel. In contrast, our van drives with petrol and Compressed Natural Gas (CNG) (it's methane, which is different from LPG). It has one 100L petrol tank and a 20kg CNG tank. It's advantageous to drive on CNG as much as possible, but tanking stations are sparse: there are less than 200 open to the public in France. Natural gas is a fossil fuel just like petrol, whereas BioGNC is a renewable fuel which is locally produced from agricultural waste. There were many BioGNC stations in the west of France, when we were there in August. After crossing the border to Spain in October, we could find many CNG stations, but no BioGNC stations. Standard GNC stations often have a small ratio of BioGNC included, which was disregarded in the following calculations. Depending on the roads, our E10 fuel consumption was around 15.2L/100km (+/-1.9). In contrast, BioGNC and GNC fuel consumption was smaller, around 9kg/100km (+/-0.7). We were mostly driving on small country roads and sometimes in mountains, we rarely used highways.
 Tanked fuels per month
Over the whole year, we have consumed 1550L of E10 petrol, 530kg of CNG and 295kg of BioGNC. To estimate our carbon footprint regarding transportation, I have converted these numbers into kilograms of equivalent CO2 emitted using the factors I could find online. These factors are different from one website to another, so here are the ones I used for reference:
- 1L of E10 emits 2.21 kg CO2 equivalent
- 1kg of CNG emits 2.96 kg CO2 equivalent (1kg of CNG has more energy than 1L of fuel, as seen in the fuel consumption plot)
- 1kg of BioGNC emits 0.61 kg CO2 equivalent
This results in a total of 5176 kg CO2 equivalent for driving the van over one year - which makes 2588 kg CO2 equivalent for each of us. An average French peron emits 2650 kg CO2 equivalent in one year for transportation, which is fairly close to us. Note that we have been emitting above average during the trip, and below average when we came back to my mother for winter.
So with respect to transportation, our vanlife has emitted about as much CO2 than an average French would. Counterintuitively, it's still a major reduction compared to our tranportation carbon footprint back when we were living in Germany. Indeed, we relied solely on public transportations back then, but we also used to take planes for both work and vacations. As an example, for our last vacation in Chile in 2019, the return flight from Frankfurt to Santiago accounted for 4100 kg CO2 equivalent for each of us! Boarding this flight alone emitted about 50% more carbon than driving the van for the whole year.
Our food diet didn't change substantially between vanlife and sedentary lifestyle and I didn't track our meat/dairy products consumption. Housing and purchasing emissions were much smaller than an average French person, thanks to sobriety. Primarily, we simply couldn't buy much at all since we were living in a confined space. We used a single 13kg bottle of propane for heating and cooking, accounting for 150 kg CO2 equivalent. We only sporadically turned the heater on for a few minutes on cold mornings, but we never slept with the heater on. Also, there's no air conditioner. Needless to say that it wasn't the optimal 20-25°C all the time like in a house, as we will see in the thermal comfort section.
Our electric appliances were all running using the energy collected from our 200W solar panels and stored in our battery. A detailed carbon footprint calculation should take into account the CO2 emitted for the lifecycle of the battery and the solar panels, from construction to destruction. There's also the energy we consumed in campings, for laundry, hot showers and so on, as well as the gas and electricity that we have consumed while we stayed at my mother place for the last 5 months. These numbers are too involved to calculate precisely this year.
With just the transportation part, 2588 kg CO2 equivalent is already above the target of 2000 kg CO2 equivalent of the Paris Agreement for a global warming of +2°C. It's quite telling, that driving did not weigh quite as much in our expenses.
How much did it cost?
We've tracked all our expenses, also because it made splitting the bills easier. Talking to other travellers, it looks like we are on the high-end of the spectrum with respect to spending. All in all, we've spent 11430€ within 144 days (the blue round trip in France/Spain/Portugal), that's an average of 2381€ per month for the two of us. I can't compare this figure with our sedentary lifestyle as I didn't track my expenses back then.
 Expenses plot
 Fuel cost
We were able to work while on the road, so we could spend without worrying too much. Food in general (groceries and restaurants) represented 49% of the total expenses. Like proper foodies, we always tried out the nice restaurants in the towns we visited. Dining out was our most important expense, representing 33% of the total budget, averaging to 183€ per week. Excluding the entries below 10€ (mostly ice creams, crêpes and tapas), we are left with 100 entries that can be considered as proper meals. On average, we ate a meal in a restaurant 5 times a week, for a price of 35€ per meal for the two of us. In comparison, a meal cooked from our groceries cost us 6€ on average, counting breakfast as a meal.
To entertain ourselves further with sporting activities, museums and so on, we spent 17% of the budget, accounting for 404€ per month. Camping only represented 8% of our total expenses, which averages to 190€ per month. This is much less than the 800€ we were paying for rent in Germany, even when adding up our gas/fuel consumption for driving around (381€/month). We did our best to drive as much as possible on GNC and BioGNC if available, which was much cheaper per km than E10 petrol: 0.12€/km for GNC versus 0.24€/km for E10. For reference, the median fueling cost per volume was 1.49€/L for E10 and 1.08€/kg for CNG/BioCNG.
The category "other" accounts mainly for local gifts we bought for friends and family, as well as public transportation.
Thermal comfort and air quality in the van
I believe that we've spent a lot more time and effort into insulating our van than most other vanlifers. Especially for the air tightness, to protect the insulation from the water vapor released by cooking and breathing. In the end it was worth it.
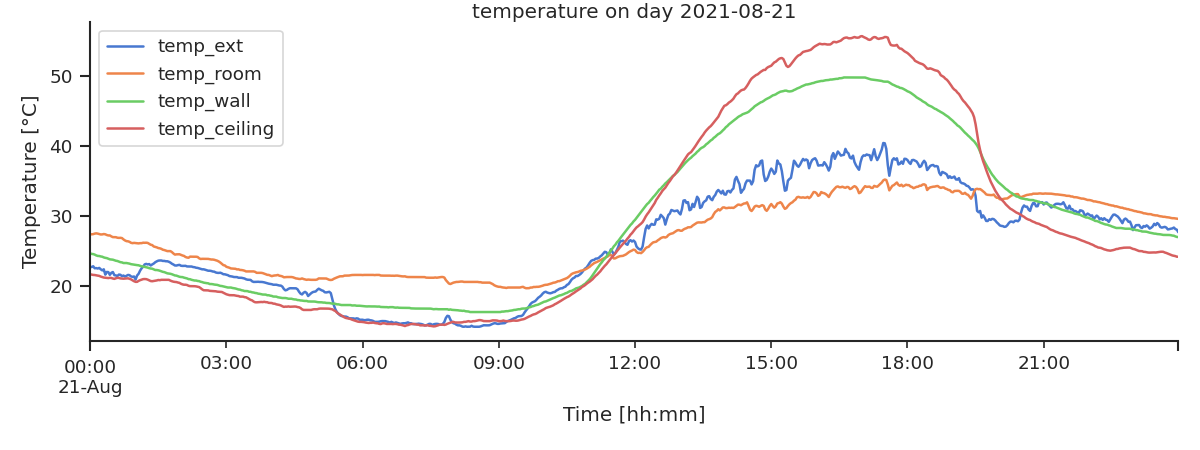
I have measured temperature and humidity in the van at four spots: in the living area, near the exterior (in the fan), and in the roof and left wall insulation (hemp). Parking the van in the sun during the summer months, the hemp in the roof could exceed 50°C. Within the van however, the temperature would "only" peak to around 30°. Here is a plot of a representative hot summer day: the 21st of August in Avignon, I spent the whole day working within the van with the door open.
 Hot summer day
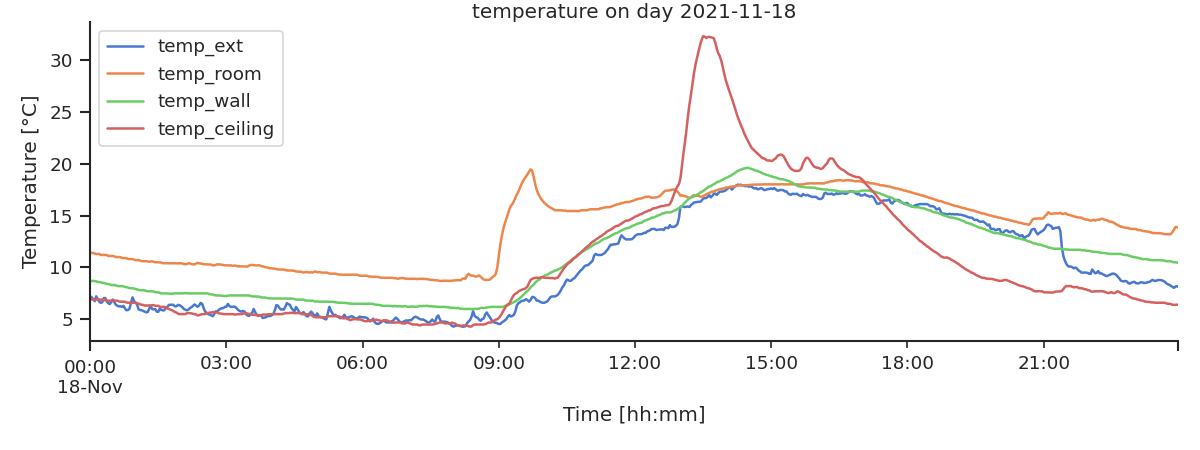
We were in Spain until the end of November, and did not spend winter in the van, so we did not have any really cold days. Here is a plot of a cold day in Grenada on the 18th of November, with a low peak at 0°C outside (just checked historical weather data online). The room temperature was 5°C above the temperature in the insulation, without any heating throughout the evening. When waking up around 9am, we turned on the heating for a few minutes which quickly warmed the room. We spent the rest of the day visiting Grenada, outside of the van.
 Cold winter day
Relative humidity in the hemp remained on average below 70% even in winter. We've also noted that air quality was better in winter than in summer, likely because the temperature difference between inside and outside increased natural ventilation. In general, air quality wasn't good according to the sensor: above 4000ppm equivalent CO2 most of the time. This sensor isn't very reliable as it doesn't measure CO2 directly though. This is something we should check in the future. Also, the computer fan we installed for ventilation was too loud for me to sleep.
What's next
Driving around was a lot of fun, although a little tiring sometimes. This coming year, we will drive less, and plan ahead for a place to live for long-term. For the time being, we use the van to visit eco-villages and participate in collaborative building sites.